
Empowering Your Decisions with Cloud-Driven Analytics and Customized Reporting
Unlock the Power of Your Data: Tailored Insights and Predictive Analysis at Your Fingertips
SERVICES
What We Do
Approach
Custom Analytics and Reporting: Transforming Data into Business Insights
Our company specializes in creating custom analytics and reporting solutions. We gather data from a variety of sources, including databases, social media, and third-party software, to generate comprehensive reports and charts. Our expertise lies in not only analyzing current data but also in employing predictive tools for forecasting future trends. These customized, insightful reports are delivered regularly to our clients, aiding them in making data-driven business decisions.

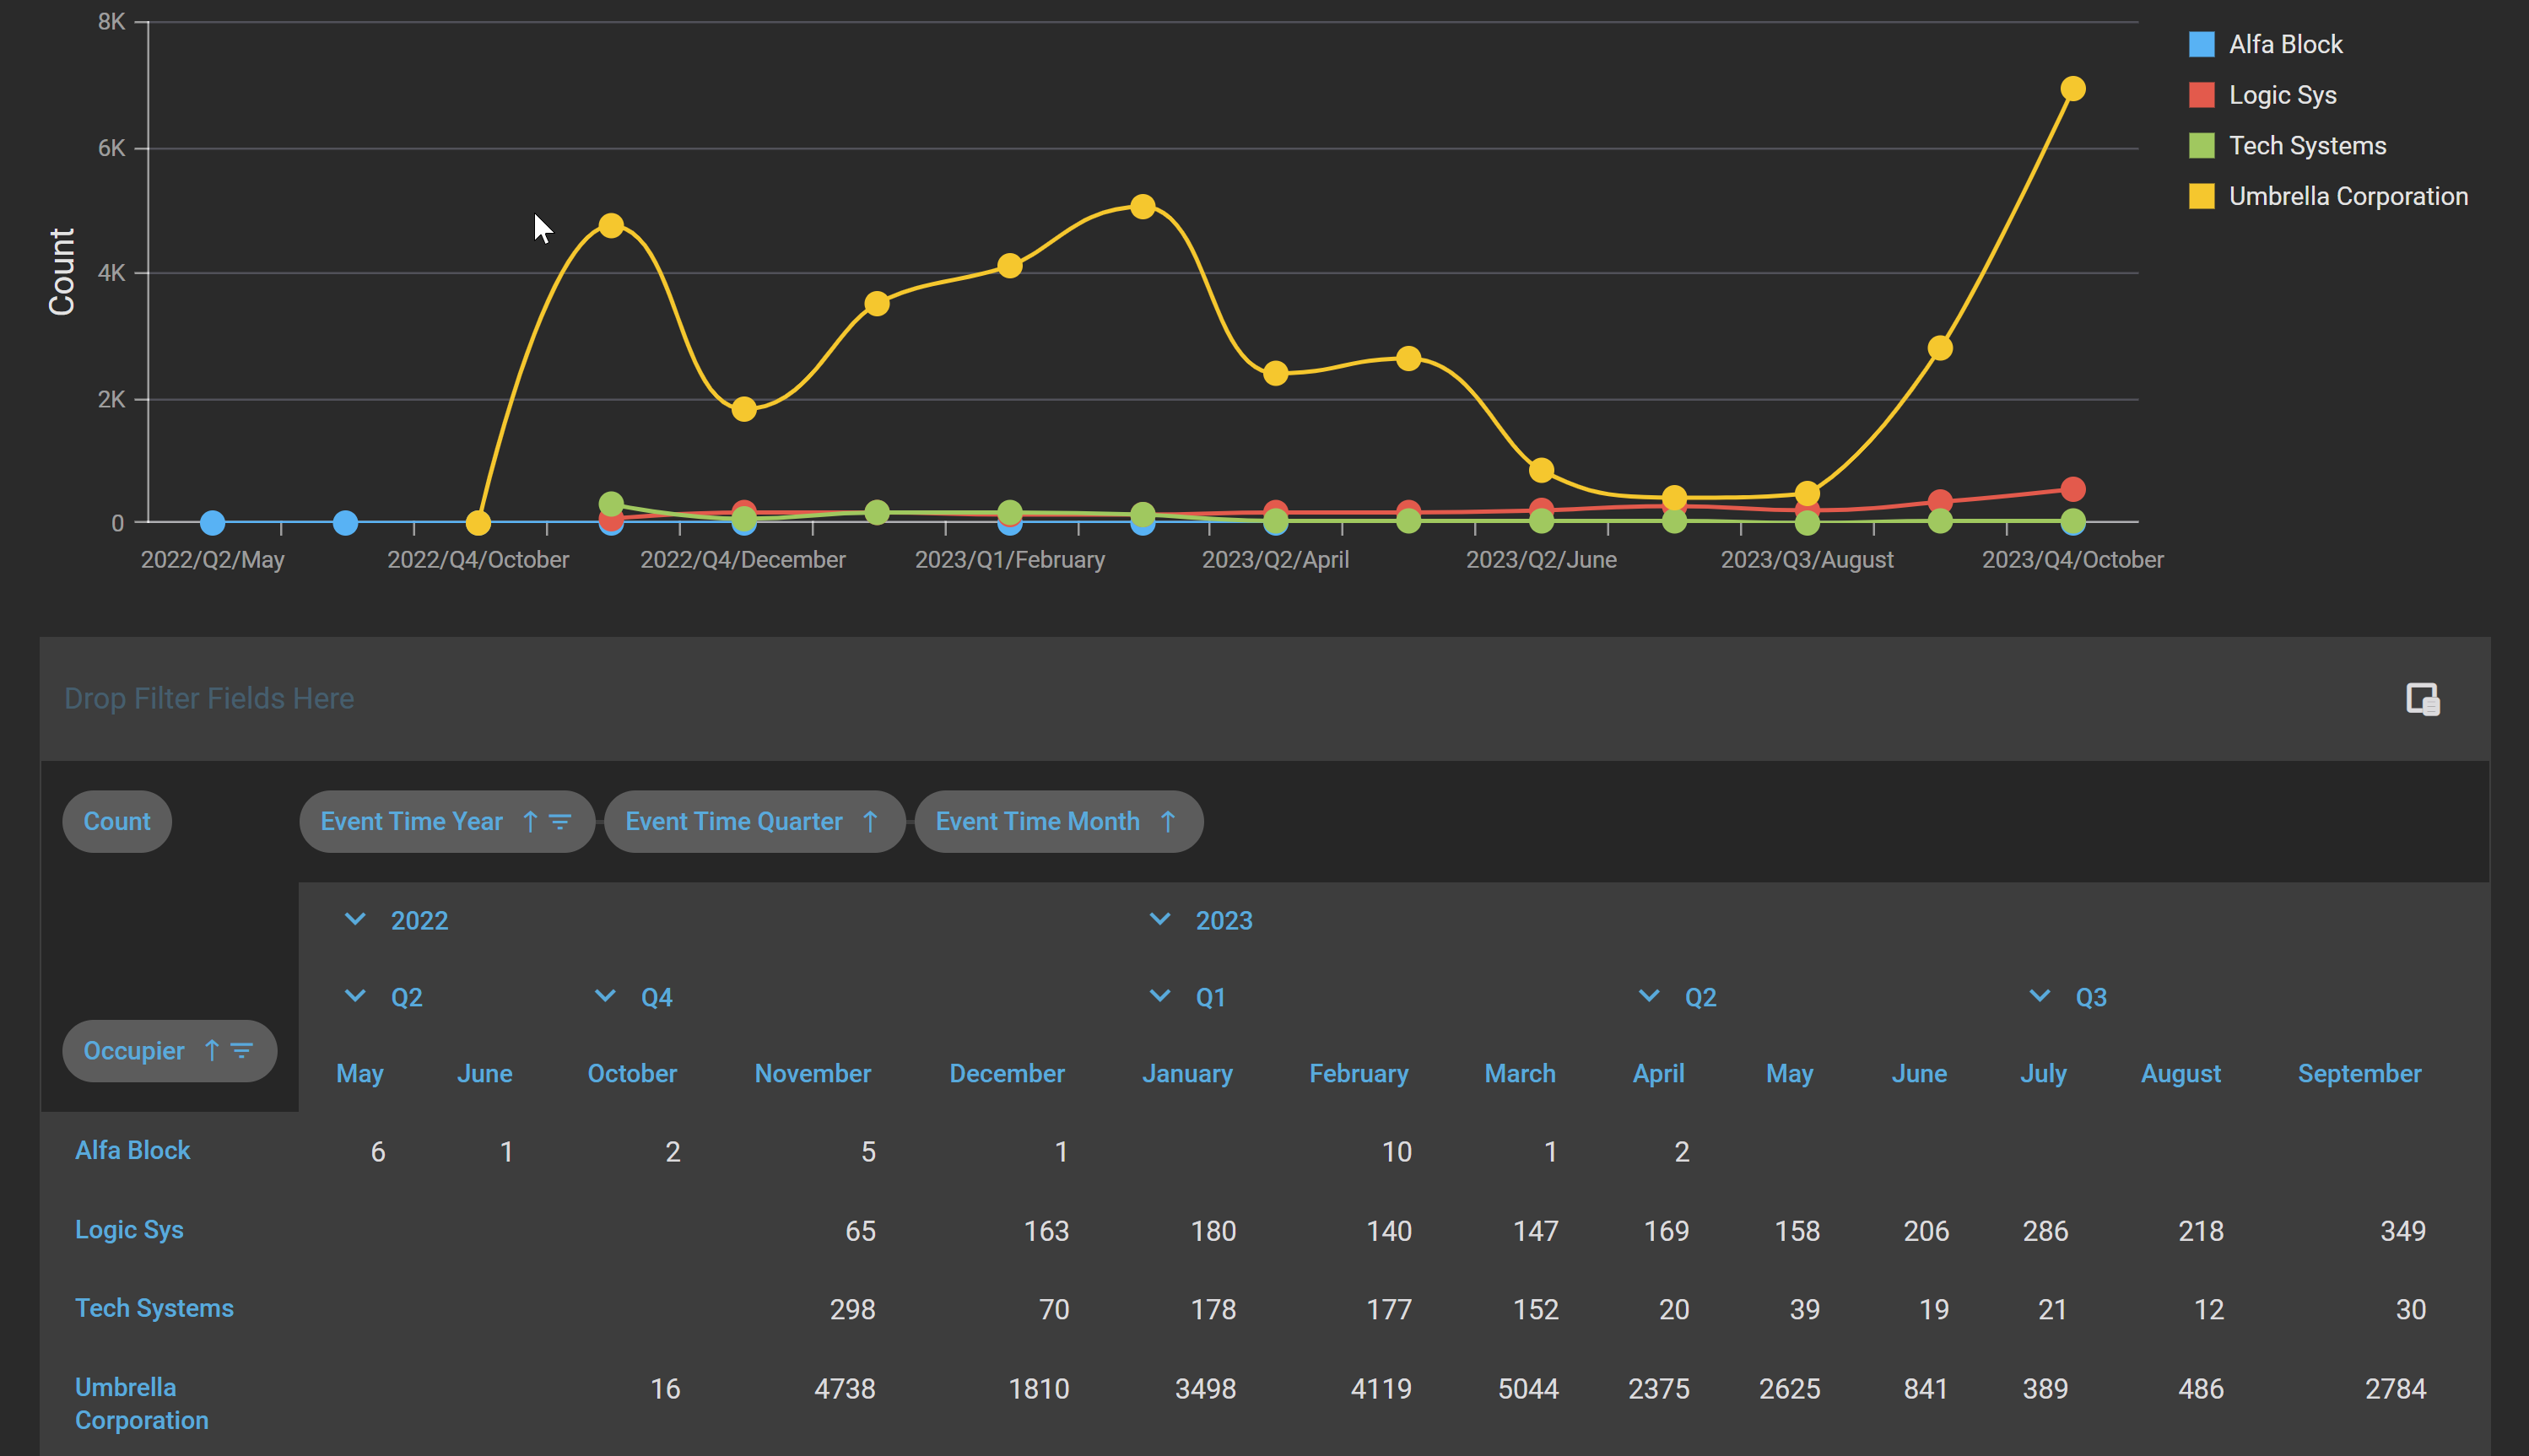
Pivot Grid with Charts
The dashboard includes both a line chart and a data table, summarizing events over time for different entities.
This dashboard helps in analyzing the distribution of events across different times and comparing the activity between the different entities. It’s likely used for business analysis, monitoring performance, or resource allocation.


Custom Analytics Solutions
Every business is unique. We offer tailored analytics solutions to meet your specific needs, ensuring that you’re always ahead of the curve.

Five Spheres. One Mission.
Reports:
“Empower Your Decisions: Our comprehensive reports provide deep insights and actionable data, helping you to make informed choices and drive your mission forward.”
Charts:
“Visualize Success: Transform data into understanding with our intuitive charts. See trends, patterns, and opportunities at a glance to navigate your path to success.”
Support:
“Always Beside You: Our dedicated support team is committed to your success. Whether you have a question, need guidance, or encounter a challenge, we’re here to help, every step of the way.”
Cloud Solutions:
“Innovate with Freedom: Leverage the power of the cloud with our cutting-edge solutions. Enjoy scalability, security, and flexibility, ensuring your data is accessible whenever and wherever you need it.”
Monitor:
“Stay Ahead, Stay Informed: Our real-time monitoring tools keep you in control. Track performance, anticipate trends, and respond swiftly to changes in your environment.”
Reports
Charts
Support
Cloud solutions
Monitor
TESTIMONIALS
Success Stories
Title: The Data-Driven Transformation
Introduction: Once upon a time, “Marcin M Automotive,” a thriving automotive retailer, faced a common challenge. Burdened by vast amounts of sales and support data, they struggled to unlock the hidden insights within. This data, including returned items and resolved support tickets, was a potential goldmine, yet remained untapped and underutilized.
The Challenge: Despite their success, Marcin M’s decision-making was often more guesswork than science. They could sense underlying patterns in their sales and customer support interactions but couldn’t quite grasp them. Their data was like a puzzle with missing pieces, leading to missed opportunities and inefficiencies.
The Turning Point: That’s when they discovered our product. They needed a solution to transform their raw data into a wellspring of insights. They were intrigued by our promise to not only organize and visualize their data but also to reveal correlations and trends they were previously blind to.
The Transformation: Once our custom solution was implemented, the change was nothing short of remarkable. Our sophisticated algorithms began dissecting their database, weaving together sales and support data. The results were displayed in intuitive reports and dynamic charts, making the once opaque data not only visible but also actionable.
The Revelation: For the first time, Marcin M saw a clear correlation between specific products and customer support issues. They identified patterns in returned items, linking them to specific support tickets. This revelation was a game changer. It allowed them to address the root causes, improving both product quality and customer satisfaction.
The Trend Analysis: Moreover, our solution unveiled trends in sales and support that were previously unseen. Seasonal spikes in certain product issues, buying patterns linked to customer support interactions, and many more valuable insights came to light. These trends were not just numbers on a chart; they were a roadmap to strategic decision-making.
The Outcome: Armed with this newfound knowledge, Marcin M reshaped its strategies. They streamlined their product lines, enhanced their customer service, and optimized their marketing efforts. As a result, they saw a significant increase in customer satisfaction and loyalty, and a remarkable improvement in their bottom line.
Conclusion: Marcin M’s journey from data-overwhelmed to data-empowered is more than just a success story. It’s a testament to the transformative power of our custom data analysis and visualization tool. Their story could be your story. Imagine what our product could do for your business, transforming your data into your most powerful asset.
Title: Transforming the IoT Industry with Smart Data Insights
Introduction: In the dynamic world of Internet of Things (IoT), a visionary company specializing in the manufacture and sale of cutting-edge IoT devices stood at the edge of innovation. Their challenge, however, was not in creating advanced technology, but in unlocking the full potential of the data their devices generated.
The Challenge: This company had a vast network of IoT devices constantly streaming data, but this treasure trove of information was underleveraged. They struggled to interpret customer usage patterns, assess device performance, and predict maintenance needs. Without the ability to turn this data into actionable insights, their growth and product development were stymied.
The Turning Point: Realizing the need for a transformative approach, the company discovered our custom data analysis and visualization product. Attracted by the promise of converting complex data into clear, actionable insights, they were poised to uncover the hidden value in their IoT data.
The Transformation: With the integration of our solution, the company witnessed an immediate transformation. Our system analyzed data from their multitude of IoT devices, synthesizing it into understandable reports and charts. Suddenly, invaluable insights were within their grasp.
The Revelation: Our tool uncovered usage patterns and device performance metrics that were previously unseen. For example, they identified that certain devices were frequently used in unexpected ways, leading to faster wear and tear. This discovery enabled them to refine their designs for improved durability and user satisfaction.
The Predictive Power: Moreover, the analysis highlighted predictive maintenance needs. By understanding the lifecycle and performance issues of their devices, the company could preemptively tackle maintenance, drastically reducing downtime and boosting customer satisfaction.
The Outcome: Armed with these new insights, the company revolutionized its approach to IoT device manufacturing and sales. They fine-tuned their product line, enhanced customer service by proactively addressing issues, and crafted marketing strategies based on real-world data usage. This led to an increase in market share, customer loyalty, and a solidified reputation as an IoT innovator.
Conclusion: This company’s journey from being data-rich but insight-poor to a data-driven industry leader is a powerful testament to the potential of smart data analysis in the IoT sector. It serves as a compelling example of how harnessing the power of data can catapult a business to new heights. Imagine the transformative impact such data visualization and analysis tools could have on your business, turning IoT data into a strategic advantage.
We're Here To Help!
Office
1 Springbrook, St Neots, England
Hours
M-F: 8am – 6pm
S-S: Closed
Call Us
0044 7778212993